← See all indicators & backtests  ·  by profitnotiondaily  ·  discord.gg/profitnotiondaily  ·  Download ATAS/X
ATAS/X Indicator · Order Flow · Delta

PND Multi-Period CVD

Three rolling cumulative delta windows in one panel. See instantly when fast, medium, and slow order flow all agree. When they align, the near-term wave of market aggressors are betting on a direction, but always confirm with price and structural levels.

Platform ATAS/X
Category Order Flow · Delta
Series 3 rolling + session + combined
Signals Tint · Markers · Alignment
Price Free · Community
Indicator preview — live on ATAS/X
PND Multi-Period CVD running live on ATAS/X — NQM6 1-minute chart
What it does

Multi-frame delta, unified in one panel

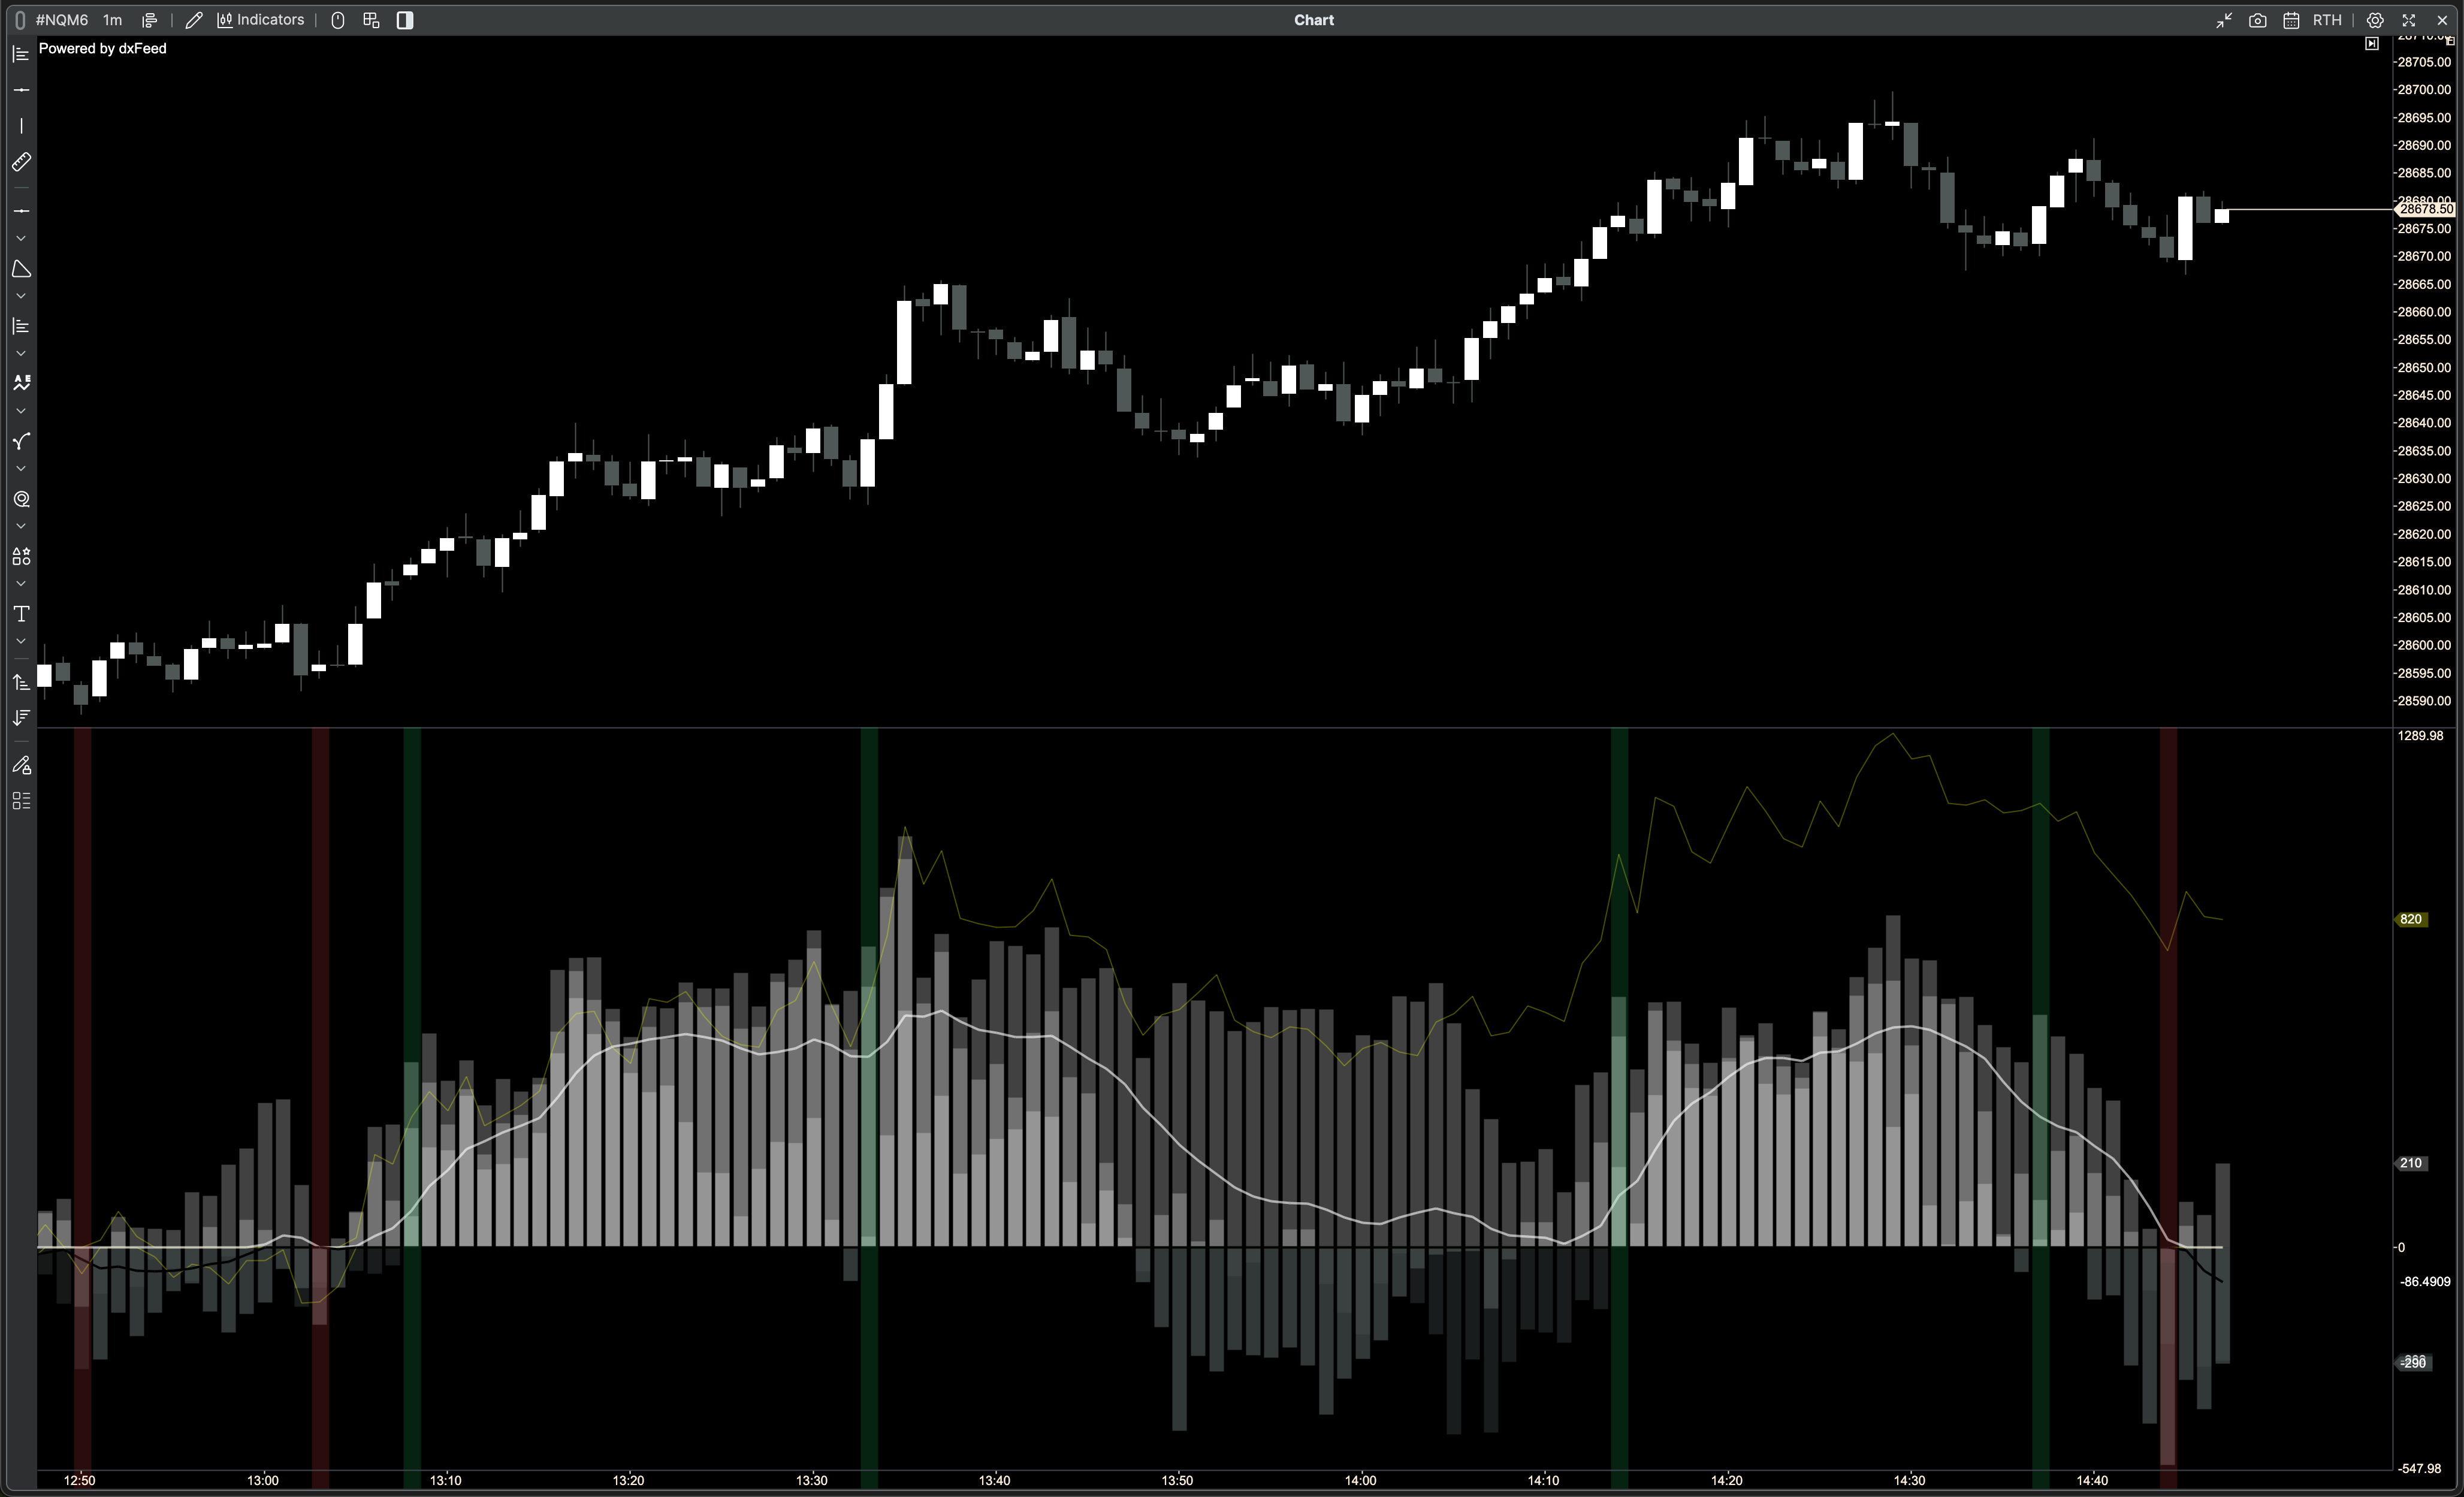
Standard CVD shows you what's happening right now. But a single-period CVD can reverse on any noise tick. The PND Multi-Period CVD stacks three independent rolling windows — fast (default 15 bars), medium (30), and slow (60) — so you can see whether the current pressure is a fleeting blip or a sustained directional move that's been building across all timeframes simultaneously.

📊
3 Rolling CVD Windows
P1 (fast), P2 (medium), P3 (slow) — each renders as crisp zero-anchored bars. All periods are fully configurable from 2 to 1,000 bars.
🌊
Session CVD
Resets cleanly at session open each day. See the full-day institutional bias alongside the rolling windows without switching panels.
〰️
Combined CVD Line
Smoothed average of all three rolling windows. Choose SMA, EMA, WMA, or Hull MA. Cuts through noise and shows the composite directional bias.
🎨
Alignment Tint
Sub-panel background flashes lime or red the instant all three CVDs cross to the same side of zero. First-bar only — not the whole aligned period.
🔺
Alignment Markers
Optional triangle, circle, square, or cross marker at the zero line on every new alignment event. Fully configurable colors and size.
Crisp Native Bars
Bars use ATAS's native candle renderer — pixel-clean edges with no blurry anti-aliasing. Looks like the built-in CVD indicator, not a fuzzy histogram.
The Signal

How alignment detection works

The indicator watches the sign of each rolling CVD every bar. The moment all three flip to the same side of zero for the first time, that's your alignment event — a single pulse, not a sustained flash.

Signal timeline — all three CVDs align
fires once per event · tint + marker
Bull signal — all 3 positive
Bear signal — all 3 negative
Combined CVD (WMA)
Session CVD
P3 (slow) and P2 (medium) already negative — fast CVD still mixed
P1 (fast) crosses zero negative → all three aligned → bear signal fires once
Subsequent bars: alignment continues but tint and marker do not repeat until a new event
Reading the indicator

What to watch for

1
Bar height = conviction
Tall bars mean more delta has accumulated over that period. A short P1 bar next to a tall P3 bar tells you the long-term pressure is strong but the fast money is hesitating — often a warning sign before a short-term pullback.
2
Bar direction = agreement
All three bars on the same side of zero means every time horizon agrees. All three positive (lime bars) = multi-frame bull pressure. Mixed directions = contested market — consider waiting for resolution.
3
Tint pulse = new alignment event
The lime or red background flash marks the exact bar where agreement just appeared. It fires once per event. A second flash means the alignment broke and reformed — a meaningful shift in market structure, not just continuation.
4
Combined line = smoothed bias
The combined CVD line (WMA by default) smooths the average of all three periods. Use it as a quick-read trend filter: price above the line with a rising combined CVD = aligned bull thesis across all measured periods.
5
Session CVD = daily institutional bias
The session line resets each day at open. A session CVD deep in positive territory tells you institutions have been buyers all day — even if the rolling windows have pulled back. Good for context, not timing.
Configuration

All settings at a glance

Every visual element and calculation is configurable — colors, sizes, periods, smoothing mode. The defaults are designed to look good out of the box on a dark ATAS theme.

1. Rolling Periods
Period 1 — Fast
15 bars
Lookback for the fastest CVD window. Reacts quickly to short-term order flow shifts.
Period 2 — Medium
30 bars
Mid-speed window. Filters noise while still tracking intraday momentum.
Period 3 — Slow
60 bars
Slowest window — represents structural conviction. Hardest to reverse.
2. Session CVD
Show Session CVD
On
Toggle the full-session cumulative delta line. Resets at each new trading day (Eastern Time).
3. Combined CVD
Show Combined CVD
On
Toggle the smoothed average of all three rolling periods.
Smoothing Mode
WMA
Algorithm for the combined line: SMA, EMA, WMA, or Hull MA (HMA). WMA and HMA have less lag.
Smooth Period
10 bars
Lookback for the combined CVD smoothing. Higher = smoother, more lag.
4a. Alignment Tint
Show Tint
On
Background color flash in the sub-panel on alignment events. First bar only.
Tint Full Chart
Off
When off, tint is confined to the CVD sub-panel. Enable to extend the flash across the price chart too.
Bull / Bear Tint Color
~18% opacity
ARGB color for bull (all positive) and bear (all negative) events. Reduce alpha for a subtler look.
4b. Alignment Markers
Show Markers
Off
Draw a shape at the zero line on each new alignment event. Off by default — enable if you want extra visual emphasis.
Symbol
Arrow
Arrow (triangle), Circle, Cross, or Square. Bull markers appear above the zero line, bear markers below.
Symbol Size
3
Marker pixel size scale, 1–8. Controls the drawn shape — not a font size.
Bull / Bear Color
Lime / Red
Color of the alignment marker for each direction. Independent from the tint colors.
Installation

Get up and running in 3 minutes

The indicator is distributed as a compiled .dll file. No coding required — just download and drop into the ATAS indicators folder.

Download ATAS/X — the order flow platform this indicator runs on.
atas.net — download →
Get the indicator DLL — join the ProfitNotionDaily Discord and grab the latest PNDMultiCVD.dll from the indicators channel.
Place the DLL in the ATAS indicators folder:
Windows: %AppData%\ATAS\Indicators\
macOS: ~/Library/Application Support/ATAS/Indicators/
Fully restart ATAS/X — .NET caches assemblies until the app is closed. Quit completely and reopen.
Add to chart — open the indicators panel, search PND Multi-Period CVD, and add it. It opens in its own sub-panel automatically.
Questions? Join us on Discord.
Live chart discussions, indicator updates, and custom order flow alerts.